
It is generally frowned upon in Excel data models to hard-code values; it is good practice to refer to cells that contain input values so that the model can be easily updated by changing the input-cell values.
However, there is another type of hardcoding happening in Excel models – the static range. Most often, it is fine to type in a formula such as =SUM(B3:B14), but if you want the range to expand with new data in cell B15, you need a range that is dynamic.
A good introduction to dynamic ranges is the example of a chart that requires monthly updates. Here is some monthly sales data to create a Clustered Column chart.
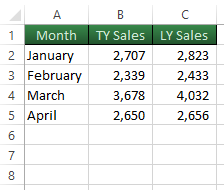
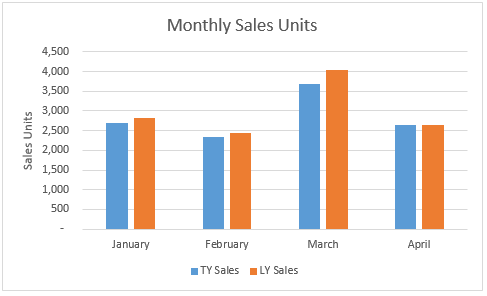
If you create a chart based on the data in cells A1:C5, it may look like the one pictured below. However, when you add data in row 6 for the month of May, the chart won't update by itself. Some may choose to manually update their ranges on a monthly (perhaps weekly or daily) basis, but this can be automated by setting dynamic ranges that grow on their own.
Excel Tables
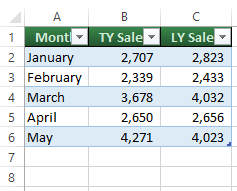
An underused feature of Excel is the Excel Table. A range of spreadsheet data can be converted to a table by simply selecting a cell in the data then clicking on the Insert tab - Tables group - Table button (Ctrl-T for my keyboard shortcut friends).
The data remains unchanged but now that it is in a table format, one of the newly granted abilities is for a table to automatically grow or shrink. If you add data in row 6 for May, the chart will automatically expand its range to accommodate the new month.
Named Ranges And The Offset Function
A more advanced and powerful way to set up a dynamic range is to use named ranges. We can create a named range that refers to a cell range that can change. This example begins with the January to April dataset on a worksheet called Sales, not the Excel table where May data was just added.
Click on the Formulas tab - Defined Names group - Name Manager button to open up the Name Manager dialog box. Create a new named range by clicking on the New button. The name of the range will by TYSales and instead of hardcoding a reference, we can use the OFFSET function to refer to a dynamic range. Type the following in the Refers to box: =OFFSET(Sales!$B$1,1,0,COUNT(Sales!$B:$B),1)
The five arguments in the OFFSET Function return the range B2:B5 using the following logic: start at cell B1 on the Sales worksheet, go down 1 row, go to the right 0 columns, make the height of the range equal to the count of numbers in column B, make the width of the range equal to 1 cell wide.
Once the first named range is complete, create a named range called LYSales where the reference is defined by =OFFSET(Sales!$C$1,1,0,COUNT(Sales!$C:$C),1) and another named range called Labels where the reference is defined by =OFFSET(Sales!$A$1,1,0,COUNT(Sales!$C:$C),1).
The final step will be to let a new chart know that these three named ranges, TYSales, LYSales and Labels will supply the data.
Create a new Clustered Column chart then click on the Design Tab – Data Group - Select Data button. Add a data series with a Series Name of ="TY Sales" and Series Values of =Sales!TYSales. The equals symbol is followed by the name of the worksheet, an exclamation point then the named range. Once the series is added, edit the Horizontal (Category) Axis Labels by setting the Axis Label Range to =Sales!Labels. Finally, add one more data series for last year sales. The Series Name is =”LY Sales” and the Series Values should be set to =Sales!LYSales.

The chart is complete and uses dynamic ranges that respond to how much data is provided. Add data in rows 6 through 8 for May, June and July and watch the chart change as you complete each cell. The chart will also shrink if you delete the row at the bottom of the data multiple times.
If you have any questions for future articles, would like to know more about using Excel, VBA, Charts, need a dashboard, data model, database solution or analytics training, please contact Scott Cuthbertson:
Email: scottjcuthbertson@gmail.com
LinkedIn: http://ca.linkedin.com/in/scottcuthbertson
Blog: http://theanalyticspro.blogspot.ca/
Scott Cuthbertson BBA
Scott is an Analytics Professional who has worked with over 100 clients in the retail and financial services industries. He has helped organizations improve their labour scheduling, inventory replenishment, performance management, organization design and pricing. He has been a practitioner of analytics since childhood, using data models to win Hockey Pools. His expertise lies in developing data models, reporting, algorithms and solutions for any organization that wants to use their data to improve decision making. He also teaches at the CMA Professional Development Institute.
© Scott Cuthbertson 2014 Blog: Words From The Analytics Pro