

Revenue by region is fixed, the Cost of Goods are a percentage of Revenue and Overhead Expenses are fixed.
This model represents a forecast of a company’s Earnings for next year. It is static, so the result is always $170,000.
If this is a best guess at a forecast then the next level is to understand the possible variability in the model’s assumptions and results. How sensitive are Earnings to changes in Revenue?
Random Numbers
Random numbers can be used to add uncertainty to the data model. Even though Canadian Revenue is forecasted at $2,000,000, the worst case scenario is $1,500,000 and the best case scenario is $2,500,000. To reflect this in the data model, a random number in this range can be used instead of hard-coding $2,000,000. There are two common ways to implement this uncertainty in Excel:
=RANDBETWEEN(1500,2500)
=1500+RAND()*1000
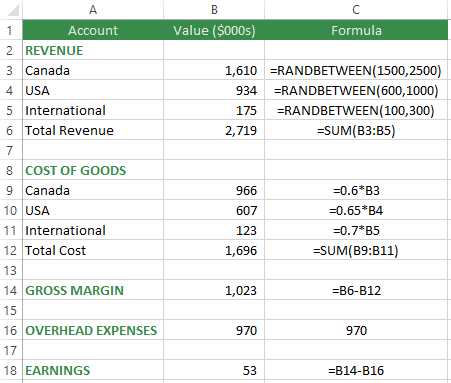 The RANDBETWEEN Function in Excel will randomly select a number within the range specified, including the lower and upper limits provided. Press the F9 key to trigger a recalculation of the Workbook.
The RAND() Function generates a random number between 0 and 1 (includes 0 but not 1). This value can be multiplied by 1,000 and added to 1,500 to generate a random number between 1,500 and 2,500.
USA and International revenue can also incorporate uncertainty in their values. USA revenue will range from $600,000 to $1,000,000. International revenue will range from $100,000 to $300,000.
Simulation: An Unorthodox Use Of Data Tables
Every time the F9 key is pressed, a recalculation of the Workbook will occur but the new scenario is not being captured. In order to capture the results from each scenario, you can use Visual Basic for Applications (VBA) code, but an easier way to capture the results is to use Data Tables.
Data tables are conventionally used to substitute a value from the first column in the table into a model parameter input cell in order to change the model and capture its result. However, in simulations, data tables can be used simply to trigger a recalculation of the same model and capture the result.


Understanding The Distribution Of Model Results

These concepts are even more powerful with larger data models. Also, simulation can also use bell-shaped or other distributions instead of a simple RANDBETWEEN Function. Simulation is about understanding how sensitive results are to changes in assumptions. This allows the modeller to assign probabilities to the likelihood of scenarios and take action early to change the outcome.
If you are interested in learning more about Excel Data Model Simulation, let me show your organization how it can introduce uncertainty into its Excel models. If you need a data model, database solution or analytics training, please contact:
Email: scottjcuthbertson@gmail.com
LinkedIn: http://ca.linkedin.com/in/scottcuthbertson
Blog: http://theanalyticspro.blogspot.ca/
Scott Cuthbertson BBA
Scott is an Analytics Professional who has worked with over 100 clients in the retail and financial services industries. He has helped organizations improve their labour scheduling, inventory replenishment, performance management, organization design and pricing. He has been a practitioner of analytics since childhood, using data models to win Hockey Pools. His expertise lies in developing data models, reporting, algorithms and solutions for any organization that wants to use their data to improve decision making. He also teaches at the CMA Professional Development Institute.
© Scott Cuthbertson 2014 Blog: Words From The Analytics Pro